I learned most of what I know about coding by looking at source code – especially view source on a web browser. Lets see if we can bring that era back a bit by using ES modules and eschewing webpack and other bundling systems. We will use the amazing unpkg.com CDN to get our building blocks to assemble together.

First get vue working

From unpkg we will link to tailwindcss in the head tag, and then import vuejs from using a script type="module" tag.

 1
 2
 3
 4
 5
 6
 7
 8
 9
10
11
12
13
14
15
16
17
18
19
20
21
22
23
<!doctype html>
<html lang="en">
  <head>
    <meta charset="UTF-8"/>
    <meta name="viewport" content="width=device-width, user-scalable=no, initial-scale=1.0, maximum-scale=1.0, minimum-scale=1.0"/>
    <title>Hello, World</title>
    <link href="https://unpkg.com/tailwindcss@^1.2.0/dist/tailwind.min.css" rel="stylesheet">
  </head>
  <body>
    <h1 id="title" class="text-xl">{{ message }}</h1>

    <script type="module">
      import Vue from 'https://cdn.jsdelivr.net/npm/vue@2.6.11/dist/vue.esm.browser.js'

      var app = new Vue({
        el: '#title',
        data: {
          message: 'Hello from Vue!'
        }
      })
    </script>
  </body>
</html>

Using import we are pulling the vue.esm.browser.js build straight from the CDN! So easy.

Add some charts

chart.xkcd is a nifty JavaScript library that lets you make charts like the stupendious xkcd. We’ll use the chart.xkcd-vue wrapper.

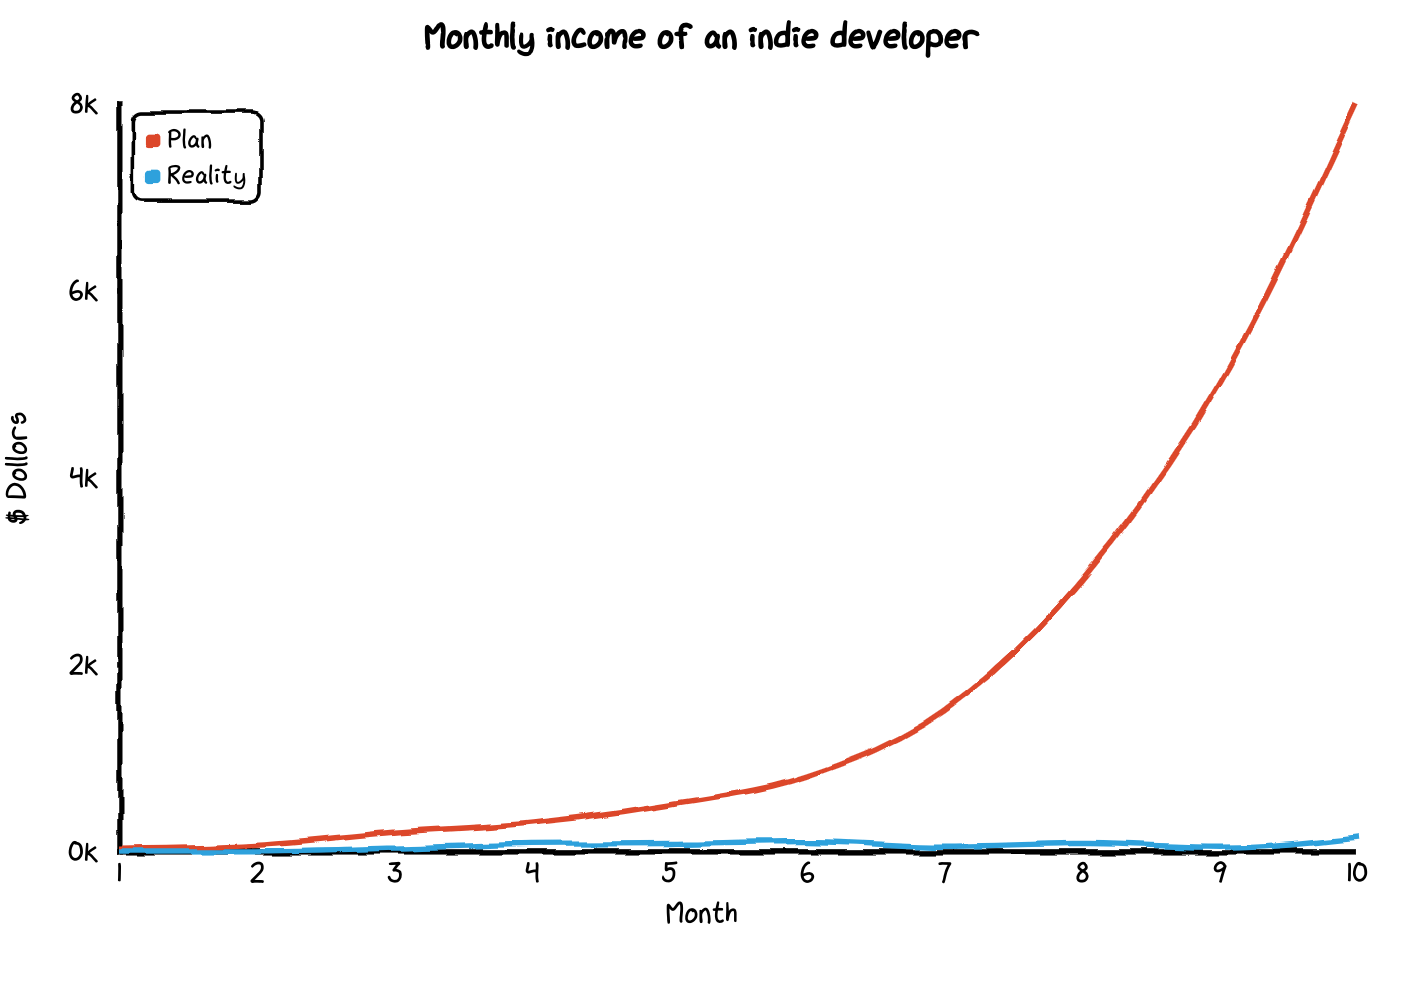
pika.dev is an index of packages that you can import as ES modules. That’s a great place to search for packages that can be imported directly. So lets import chartXkcd and wire it up with some sample data.

 1
 2
 3
 4
 5
 6
 7
 8
 9
10
11
12
13
14
15
16
17
18
19
20
21
22
23
24
25
26
27
28
29
30
31
32
33
34
35
36
37
38
39
40
41
42
43
44
45
<!doctype html>
<html lang="en">
  <head>
    <meta charset="UTF-8"/>
    <meta name="viewport" content="width=device-width, user-scalable=no, initial-scale=1.0, maximum-scale=1.0, minimum-scale=1.0"/>
    <title>Hello, World</title>
    <link href="https://unpkg.com/tailwindcss@^1.2.0/dist/tailwind.min.css" rel="stylesheet">
  </head>
  <body>
    <div id="app" class="min-h-screen">
      <chartxkcd-line :config="config"></chartxkcd-line>
    </div>

    <script type="module">
      import Vue from 'https://cdn.jsdelivr.net/npm/vue@2.6.11/dist/vue.esm.browser.js';
      import chartXkcdVue from 'https://cdn.pika.dev/chart.xkcd-vue@^1.1.0';
     
      Vue.use(chartXkcdVue);
      
      var vm = new Vue({
        el: "#app",
        data: {
          config: {
            title: 'Monthly income of an indie developer',
            xLabel: 'Month',
            yLabel: '$ Dollors',
            data: {
              labels: ['1', '2', '3', '4', '5', '6', '7', '8', '9', '10'],
              datasets: [
                {
                  label: 'Plan',
                  data: [30, 70, 200, 300, 500, 800, 1500, 2900, 5000, 8000]
                },
                {
                  label: 'Reality',
                  data: [0, 1, 30, 70, 80, 100, 50, 80, 40, 150]
                }
              ]
           }
        }
      }
      });
    </script>
  </body>
</html>

Which should generate the following image:

Pulling in data from a file

We can shift the code to pulling out the data from a seperate json file. I’m using a trick here to wrap everything in an anonymous function so I can use async and await to load stuff from the network. (I’m not a JavaScript developer so there could be a more awesome way to do this.

1
2
3
4
5
6
7
(async () => {
  const result = await fetch( './dataset.json' )
  const data = await result.json()

  ... old code using the data loaded from a file ...

})()

Consuming files that are easier to make with shell scripts

Lets write a couple bash commands to look at the number of commits in a repo organized by month.

  1. Create a file with a header.
  2. Get the dates of all of the commits in the log using git log and the --pretty=format command since a year ago.
  3. Get rid of all the time after the month using sed. (The three characters before the T is the - and the two digit day.)
  4. Run it through uniq to get the count
  5. Format the output with awk, print a header using BEGIN and switch the order of the data and put a comma between it.

Is this the right way to make a CSV file? No. But it’s easy to copy and paste.

1
2
3
git log --reverse --pretty='format:%aI' --since="1 year ago"|\
sed 's/...T.*//'|uniq -c|\
awk 'BEGIN {print "Month,Commits"} // {print $2 "," $1}' > commits_by_month.csv

That gives us a csv file like this:

Month,Commits
2019-03,8
2019-04,43
2019-05,3
2019-07,15
2019-08,2
2019-09,3
2019-12,17
2020-01,11
2020-02,18

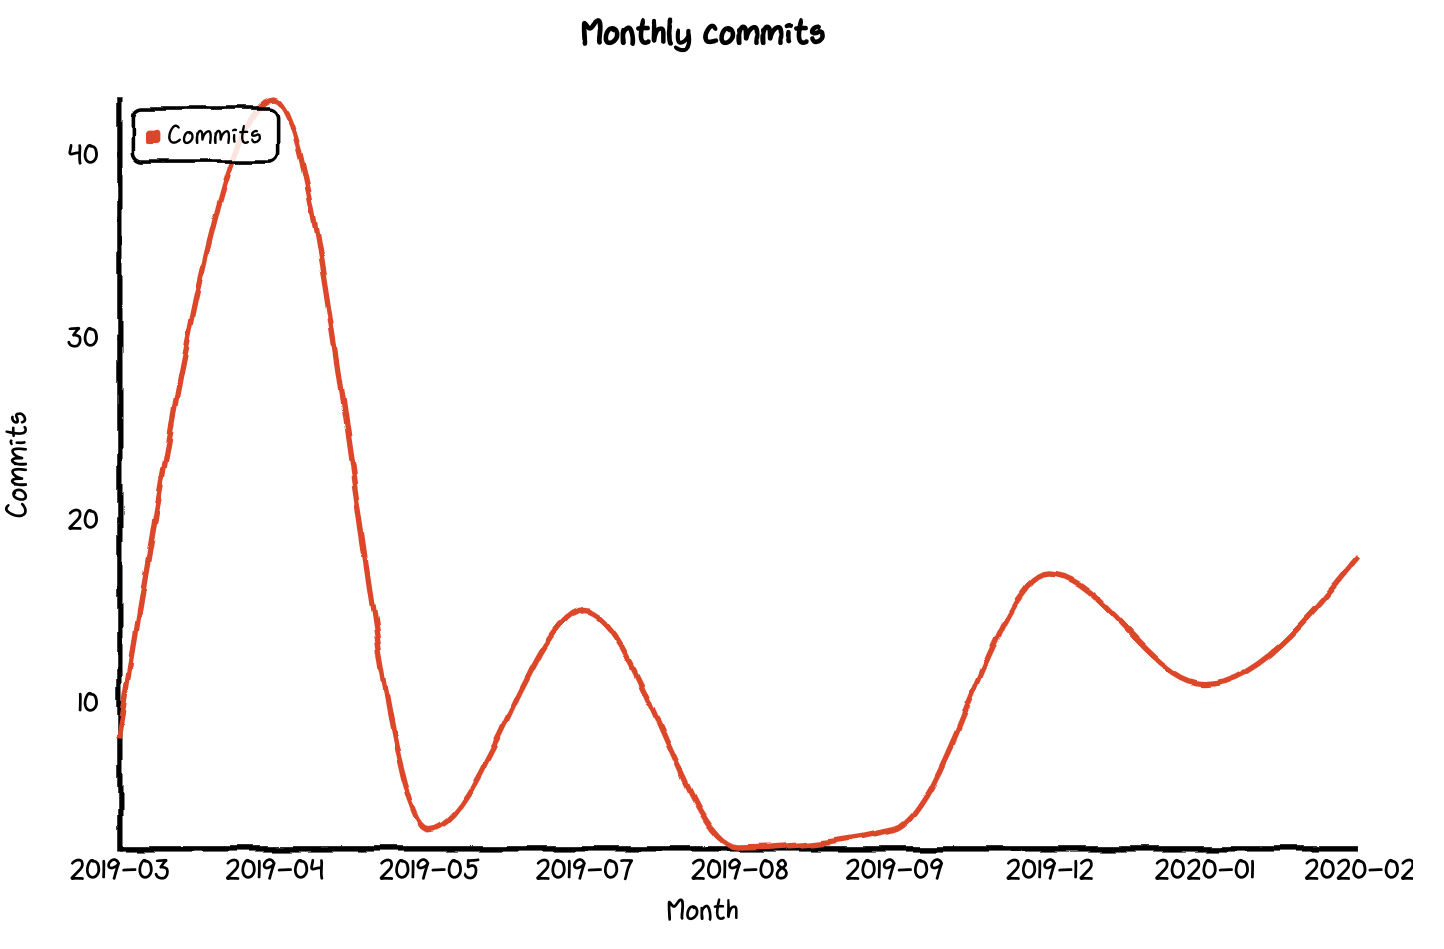
And now we can hack together some JavaScript to parse this file and create a data driven dataSet that we’ll pass off to the charting library.

 1
 2
 3
 4
 5
 6
 7
 8
 9
10
11
12
13
14
15
16
17
18
19
20
21
22
23
24
25
26
27
28
29
30
31
32
33
34
35
36
37
38
39
40
41
42
43
44
45
46
47
48
49
50
51
52
53
<!doctype html>
<html lang="en">
  <head>
    <meta charset="UTF-8"/>
    <meta name="viewport" content="width=device-width, user-scalable=no, initial-scale=1.0, maximum-scale=1.0, minimum-scale=1.0"/>
    <title>Hello, World</title>
    <link href="https://unpkg.com/tailwindcss@^1.2.0/dist/tailwind.min.css" rel="stylesheet">
  </head>
  <body>
    <div id="app" class="min-h-screen">
      <chartxkcd-line :config="config"></chartxkcd-line>
    </div>

    <script type="module">
      import Vue from 'https://cdn.jsdelivr.net/npm/vue@2.6.11/dist/vue.esm.browser.js';
      import chartXkcdVue from 'https://cdn.pika.dev/chart.xkcd-vue@^1.1.0';
     
      Vue.use(chartXkcdVue);

      (async () => {
      const result = await fetch( './commits_by_month.csv' );
      const data = await result.text();

      // "Parse" the csv
      const lines = data.split( "\n" );
      const header = lines.shift();
      const [xLabel,yLabel] = header.split( "," );

      // Map out the structure of the graph data
      const dataSet = { labels: [], datasets: [ { label: yLabel, data: [] } ] };
      lines.forEach( (line) => {
        if( line != "" ) { // Skip over the last line
          const [x,y] = line.split( "," );
          dataSet.labels.push(x);
          dataSet.datasets[0].data.push(parseInt(y));
        }
      } );

      var vm = new Vue({
        el: "#app",
        data: {
          config: {
            title: 'Monthly commits',
            xLabel: xLabel,
            yLabel: yLabel,
            data: dataSet
           }
        }
      });
      })()
    </script>
  </body>
</html>

Parsing a csv file using split and not bothering to do any error checking for parseInt is serious cowboy style coding, but it is something that we can hack together quickly. Just expect to throw it out after you get it working.

Next steps

With this basic framework in place, you create simple visualizors of data in a self container file. Write some scripts that output JSON, and then move this HTML file around to parse and display them.

Everything that you need is in one file, there’s no build process, you can copy and tweak it around. This is code that is meant to be deployed in on off situations, and when it break you throw it away and write it again.

Previously

trailofbits/algo

2020-02-07

Next

alpinejs/alpine

2020-02-20

howto

Previously

Playing with tailwindcss An excersize in minimilism

2020-02-01

Next

Emacs Tramp tricks Replacing terminals with emacs

2020-03-01